NorSea Power BI Resource Page
April - June 2021. Be aware that there could be some issues regarding duplicate facility/site information and dulicate employees in reports because of work related to the NorSea Logistics merger.
There will be missing historic time transactions for some employees until the duplicates are fixed in M3.
If you notice any issues, please report them to support@norseagroup.com
FAQ
The data looks old. Are there any issues with the data loads?
Every day there are over 2000 dataloads from the source systems in the model at the bottom of this page. If any of them have failed in the last two days they will show in this table:To see all loads you can open the full report here. If a data load fails it will usually run successful next time. I am automatically notified every time it fails so if it fails many times on a day I will fix it ASAP. After the data have been loaded from source systems, all the Power BI reports must run. This can sometimes take a couple of hours.
Go to Microsoft Microsoft Power BI Status Page to check for current Service Outage/Degradation og Technical Issues. You can also check the Microsoft Power BI Community to see if other experience the same problems as you do. Microsoft will usually explain the root cause and give an estimated time of deploying a fix.
Go to Teach Me! for information about specific reports, Power BI and Business Intelligence in general.
How can I order a new Power BI report, or modifcations done to an existing report?
Please write a Pureservice Request by clicking on the link or sending a mail to support@norseagroup.com. An IT Request is much easier to prioritize than just an email or Skype message. You can still send an email with addtional information, but without an IT request there is a bigger chance of it getting lost with the other mails. These are the open requests that are currently being worked on (green requests are prioritized):I have never used Power BI. How do I get access?
To get basic access you can write an IT Request and ask for a license (or Office E5) and membership to the best suited BIA_FAC* AD-group. If you need extended access you have specifically ask for this.There are so many reports but I can't find the one I am looking for
I you can't find the report by navigating via Apps and Dashboard you can try to search for it in the top-right corner of the home page:
If you have a report that you use alot you can mark it as a favourite and it will show up on the home page for easy and fast access.
Are there many of my colleagues that use Power BI
Yes! We even share some reports with our customers. Here you can see the total usage of NorSea Power BI in the last three months:Why are the reports not opening or very slow?
This is usually because of cloud issues at Microsoft. Check Microsoft Power BI Service Status. If they have problems we just have to wait until they fix it. If they don't we still just have to wait, but it would be nice if you sent an email to Anders Underbakke to notify me about the problems.What can I do if something looks wrong in a report?
Power BI reports are a presentation based on a set of rules defined by the report requestor that shows data generated in other systems like M3, Aditro and Liveload. Please check if the data is wrong in the source system too. If it is, you should notify the owner/superuser of that module/data. If there is a mismatch between the source system and Power BI report please let me know and I will fix it ASAP.I need a new report. How should I ask for it?
Give as much details as you can. Both technical details about where the source data can be found and graphical spesification about what you actually want to see in the report.
Bad specification: I need at report that shows me the weather at Mongstad.
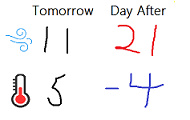
Good specification: I need a report that shows forecasted Wind (Meter per Second) and Temperatur (Celcius) for the next two days at Mongstad Base, Lindås (Hordaland). If there are different forecasts during the day I would like the report
to show the highest wind and lowest temperature. It must look something like the attached sketch where the wind is red if it is higher than 20 and temperature is blue if it is lower than 0. The source data can be found in a system called Yr.
Here is a link to the program/page where you can find the data. The wind is in the "Vind" column and Temperature is in the "Temp" column.
I need a new table or column in the database i use to build reports. How should I ask for it?
Give as much details as you can. Both technical details about where the source data can be found and screenshots. Also add the the final report need so that we know how to prioritize.
Bad specification: I need a new column called Unit in the Workorder table.
Good specification:
I would like to see which Unit gets the income from a Workorder.
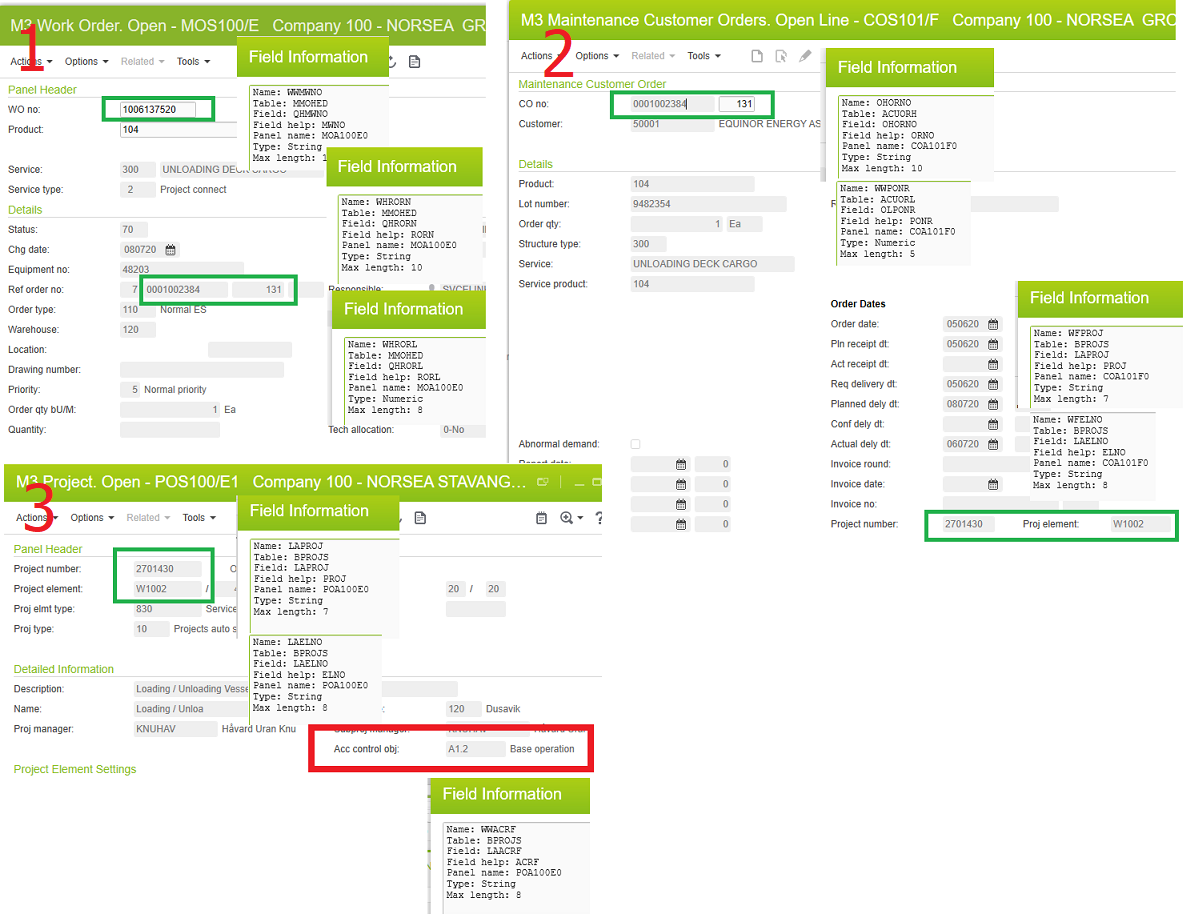
You will have to extract the Unit of the Project Element that the Workorder is connected to. But do not use the Project Element that is directly connected to the Workorder in MOS100.
You must go via the MCO Line because they may not be the same. Here is an example with screenshots and field information:
1. Open the Workorder (QHMWNO) in MOS100 (MMOHED) and find MCO (QHRORN) and MCO Line (QHRORL)
2. Open the MCO and MCO Line (OLPONR) in COS101 and find Project(BPROJS.LAPROJ) and Element (BPROJS.LAELNO)
3. Open the Project Element (LAELNO) in POS100 (BPROJS) and find Unit in LAACRF
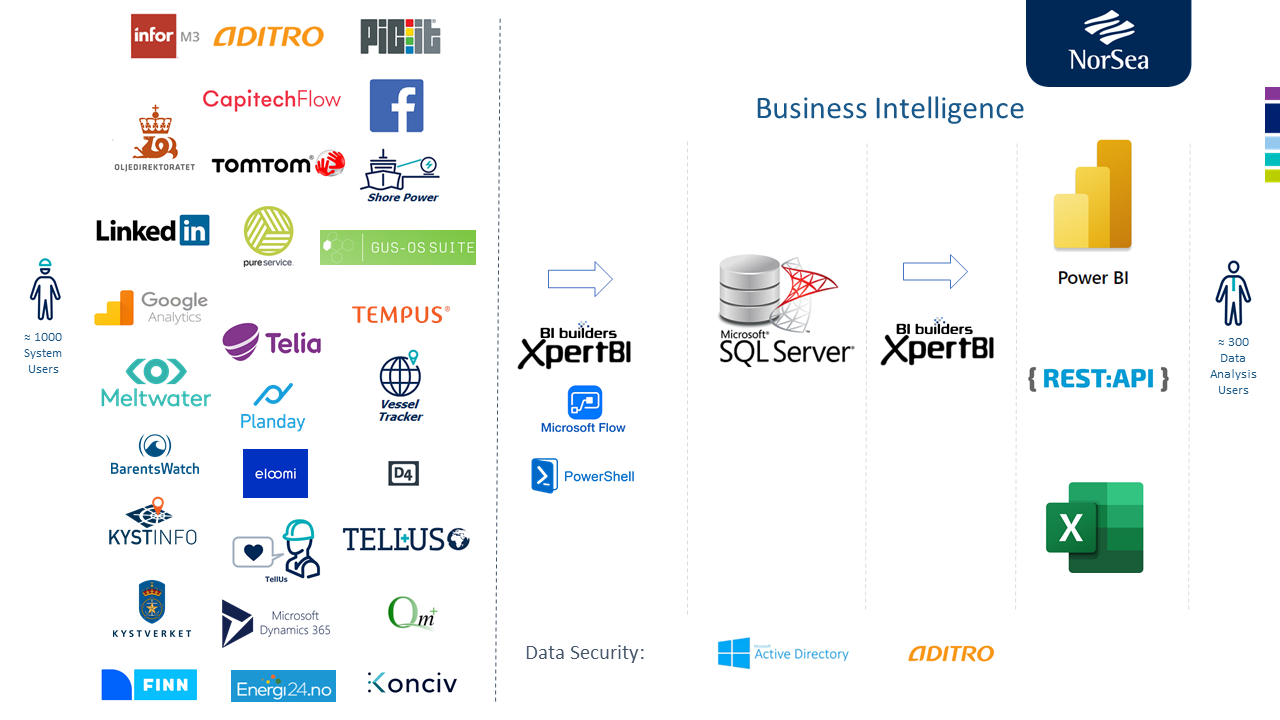
What data is availble to build reports on?
There are many different sources as you can see from the dataflow model below. The data from all sources are connected and can be added to the same reports to provide new insights. If you need a report with additional data from another system we can see if we can extract data from there as well.